Case study · Courtney & Nelson · Wholesale distribution
£33,000
estimated saving a year
A live view of sales for management and every rep.
A sales dashboard and a rep phone app that replaced hand-built Excel reports, fed automatically from the company's sales system every morning.
£33,000
estimated saving a year
1,070 hours
of staff and driver time a year
35 hours
a month of reporting work removed
14 months
to pay for itself
The problem
Courtney & Nelson supplies about 750 shops across Northern Ireland through eight field reps. The sales data existed, but nobody could see it in a useful shape.
The weekly huddle and monthly reports were built by hand in Excel from a daily export. The numbers were rarely sense-checked, often carried spreadsheet errors, and were hard to read by the time they reached the meeting.
Reps had no view of their own performance, their customers' spend, or who had stopped ordering.
Targets lived in a separate budget spreadsheet, so comparing target to actual was a manual job.
Questions like "where are we losing customers?" or "which shops don't we supply?" took a day of spreadsheet work.
How it worked before
A daily Excel workbook exported from the sales system: cross-tab pivots of 800 customers and 3,100 products by fiscal week. Everything else was built from that by hand, with formulas copied week to week. Errors crept in, and nobody could easily tell a real movement from a spreadsheet mistake. There was no map, no customer history, and nothing on a rep's phone.
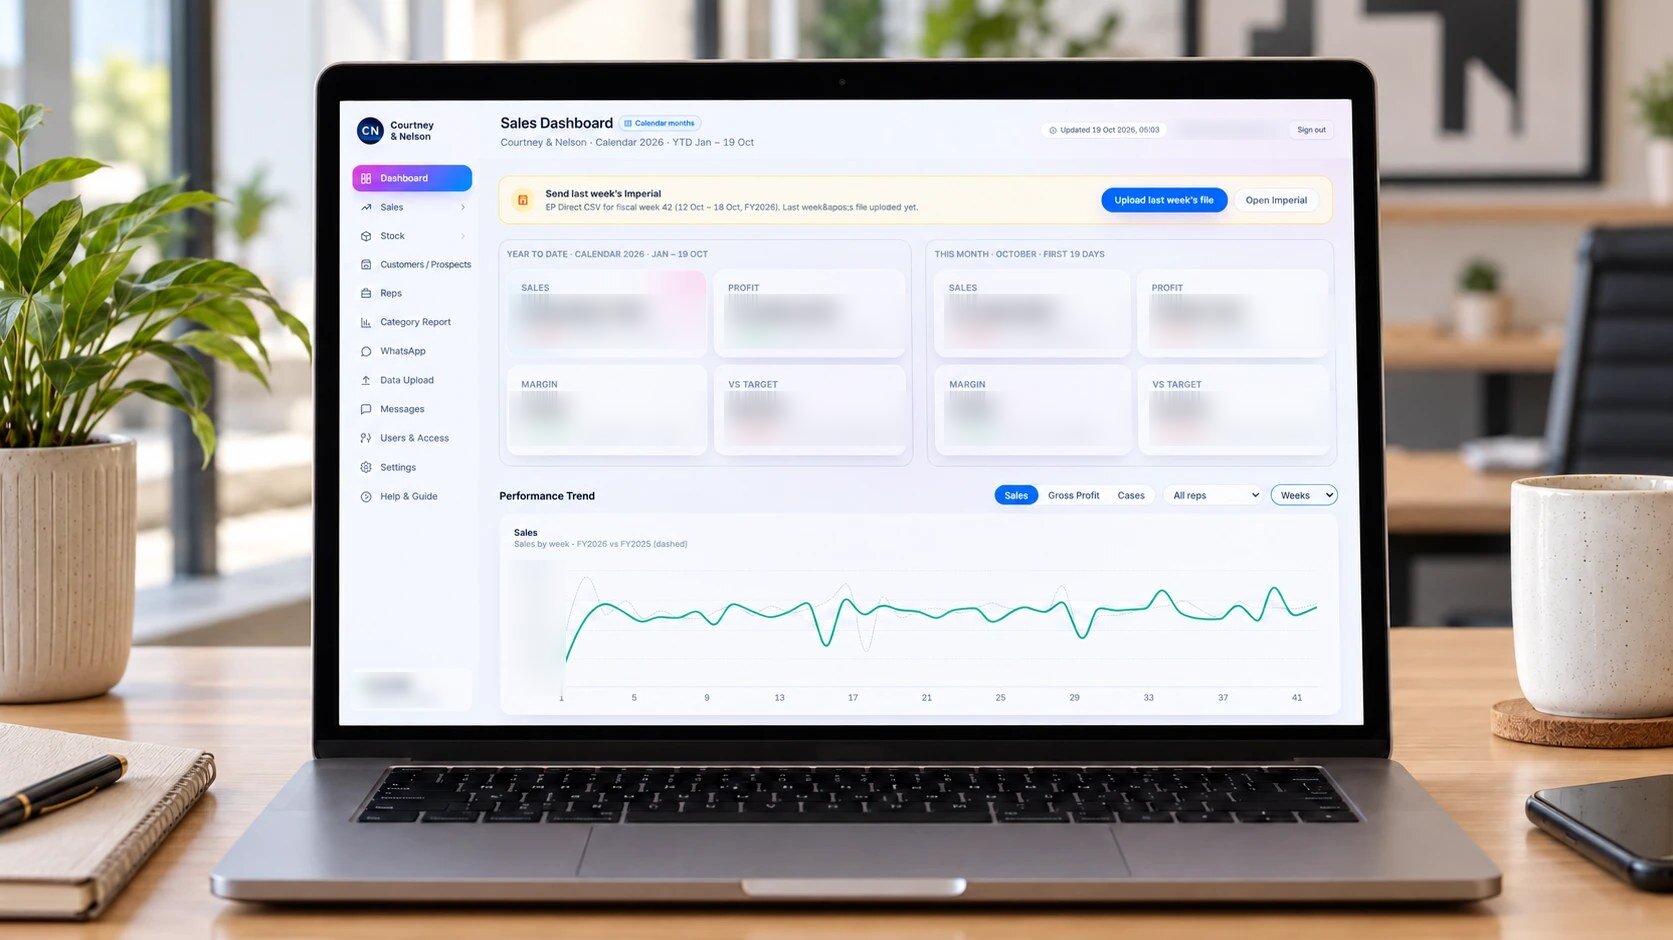
The management dashboard. Sales, profit, margin and target against last year, updated every morning. Huddle and monthly reports print to PDF, so the meeting rhythm didn't change.
What we did
Started from the real export. We built a parser that turns the pivots into a proper database, with the customer and product sheets cross-checked against each other on every import.
Shipped the management dashboard first, in June 2026, with huddle and monthly reports that print to PDF so the meeting rhythm didn't change.
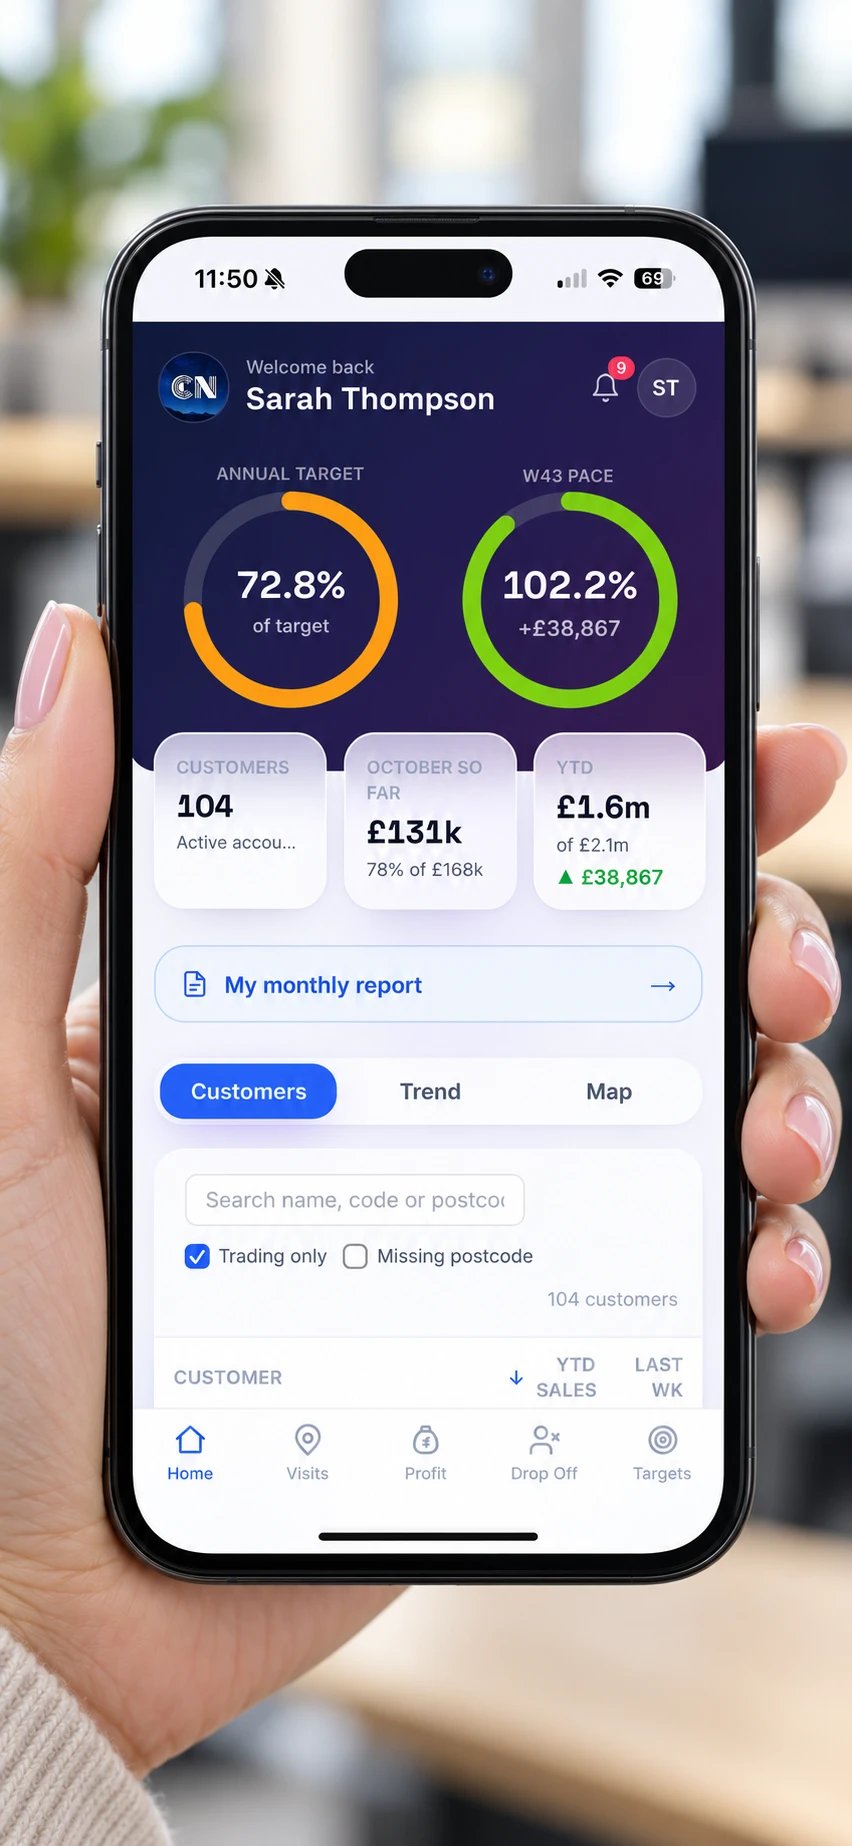
Added the rep app in July 2026. An installable web app, locked down on the server so a rep only ever sees their own customers, with drop-off alerts, a target tracker and a monthly report.
Replaced the manual upload with an automated feed from the company's sales system, pulled at 5am every morning, with a refresh button and an alert if a load is missed.
Kept building on the same data as C&N asked: calendar-month reporting that reconciles with the accounts, budgets by rep, a reps' monthly report, a seasonal category report, stock and a quote builder, WhatsApp opt-in tracking, a rep run planner, truck delivery-route planning, and a Prospector that maps every registered food outlet in Northern Ireland against C&N's customers and truck routes.
Worked alongside the people using it. We're embedded with C&N and work without a requirements document, so changes came straight from what reps and management said that week. Jeff Tosh, CEO, backed the build from the start and pushed for the reps to have it on their phones. Jonny McWilliams, Sales Director, shaped the reports, targets and rep views around how the sales team works.
The results
Total estimated saving: about £33,000 a year. That's about 1,070 hours of staff time, worth roughly £24,500 at typical staff costs for each role, plus about £8,900 in fuel and software costs.
Saving
Per year
How it was worked out
Reporting and sales tracking time
420 hours
15 hours a month of the Sales Director's time on huddle and monthly reports, plus 20 hours a month across the team on stock reporting and customer sales tracking. C&N's own estimates.
Driver time
650 hours
The reworked delivery schedule cuts the trucks' week from about 86 driving hours to 73 for the same 621 drops. Modelled from real road drive times.
Fuel
£7,700
The same schedule takes the week from 4,737 km to 4,111 km. Costed net of VAT at C&N's own fuel price and mpg. Modelled, not yet measured on the road.
Route-planning software avoided
£1,200
An off-the-shelf package would cost around £100 a month.
Total
£33,000
Estimated, per year
Other improvements
Reps see their own spend, lapsed customers and budget position on their phone for the first time.
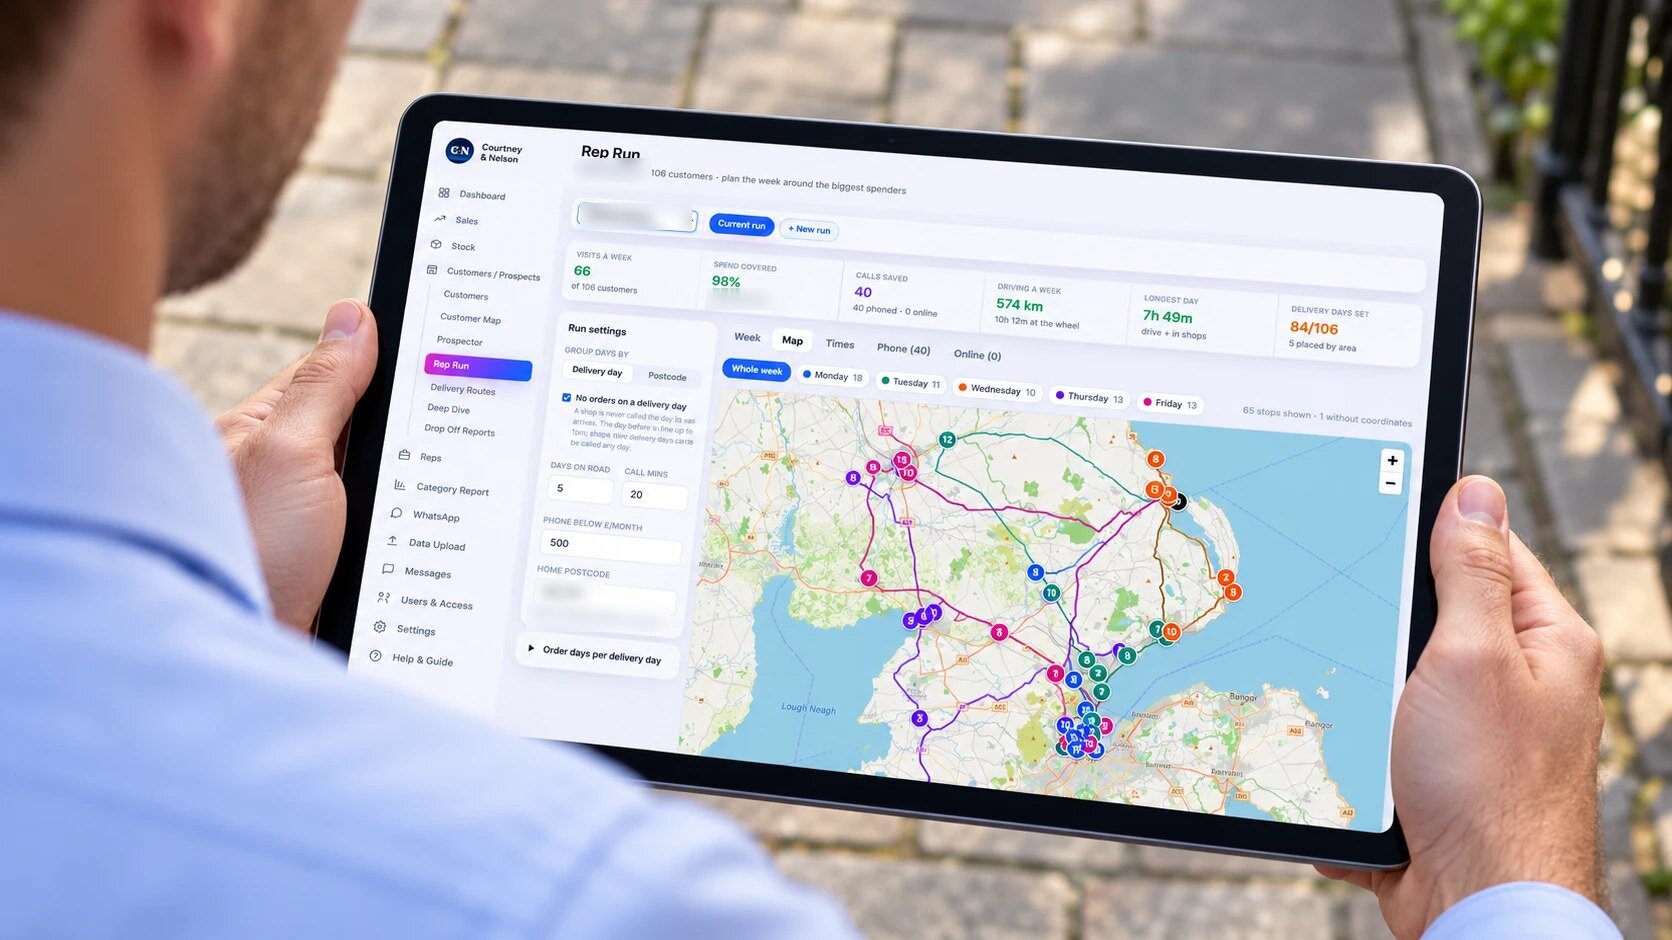
The run planner showed one rep covering 95% of their spend in 69 visits, and cut their planned week from about 1,600 km to under 700.
The Prospector shows about 2,500 shops C&N doesn't supply, 1,600 of them within 2 km of an existing truck drop.
Figures now reconcile to the penny against the source system, so the meeting starts from numbers everyone trusts instead of arguing about the spreadsheet.
The old daily export took five minutes, so the automated feed saves little time, but the figures are now there every morning without anyone having to remember.
The rep run planner: a rep's week of visits planned around the biggest spenders, with the driving worked out.
What C&N say
"
Before the dashboard our numbers lived in a spreadsheet that one person built every week. Now everyone, from me to the reps on the road, opens their phone and sees exactly where they stand, and it's right every morning without anyone touching it. It's given us back hours every month, but the bigger change is that we're deciding on what's actually happening rather than what we think is happening.
Jeff Tosh, CEO, Courtney & Nelson
"
I used to lose the best part of two days a month building the huddle and monthly reports, and even then I'd be checking the spreadsheet in the meeting because something didn't look right. Now the reports are just there, every week, and they add up. I spend the time on what the numbers are telling us, and the reps can see their own figures before I've even asked.
Jonny McWilliams, Sales Director, Courtney & Nelson

 Verona AI